
INTRODUCTION
The adoption of any new tool into an existing Software Development Process with an established code base is always a challenge. Static analysis tools are no different but there are steps to take to make the transition easier and smooth the introduction of these tools into an existing workflow. In addition, the techniques outlined here are useful on an ongoing basis to introduce new static analysis features and get the most return on investment from static analysis.
This paper doesn’t cover the initial setup and installation of GrammaTech CodeSonar, those steps are covered well in customized setup guides based on operating system and intended use. The assumed initial point is after the first complete analysis, when the first time static analysis results are available for a project. Note, it’s critical to address parse errors encountered during the initial analysis before proceeding further with the results. Not resolving these errors leads to gaps in the analysis and more false positives and possibly missed problems (false negatives) as well. After dealing with as many parse errors as possible, the question now is how to use this data to have a big impact on the quality and security of the software and where to focus development efforts.
As is common with the initial use of a static analysis tool, there are many items to sort through and this may seem overwhelming are first. This paper is aimed at reducing the initial shock and help the development team to improve quality and security efficiently.
FIRST COMPLETE ANALYSIS
An initial analysis with the default settings may look like something like Figure 1. This example is open source database project postgres which has approximately 1 million lines of code. Over 3700 warnings are generated. In the case of the postgres example, a significant portion of these reports are Null Pointer Deference followed by Redundant Condition, Uninitialized Variable, Ignored Return Value and so on.
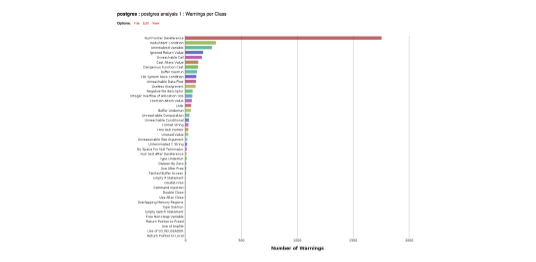
Figure 1: Example output from the postgres project as a histogram ranked by number of warnings in each class
A more common view is the main warnings report as shown in figure 2. Of note in the initial warning report is the score column. The score is an important metric that is a combination of several factors: The first is the likelihood that the warning represents a true positive (the error in the warning is correct.) The second is the severity of the warning, in particular if it’s security-related. The third factor is the complexity of the warning, with more-complex warnings generally receiving lower score values than less-complex warnings. The warning score is an important metric to help prioritize work in CodeSonar.
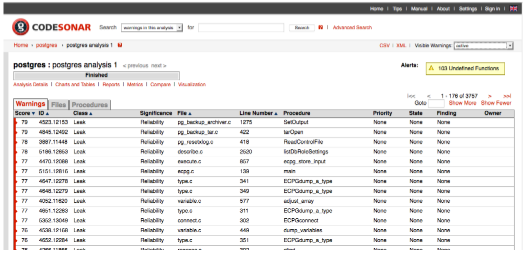
Figure 2: An example of the main warning report page
Another view is to sort the warnings by file which helps highlight potential problem areas in the code, as illustrated in figure 3 (this view is zoomed in to the first 20 files). In this case, there are over 1000 warnings in the first ten files listed.
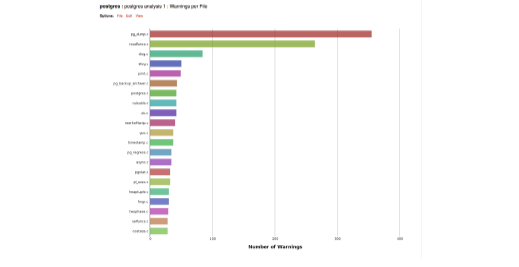
Figure 3: A histogram showing a ranking of warnings per file.
It’s possible to use filters to further specialize the view of the warnings depending on the job at hand. Learning to deal with the volume of reports during the early adoption phase helps stop the tools from overwhelming the development team.
SEARCHING
CodeSonar offers a flexible search mechanism (with the ability to save searches) that helps narrow down a large list of warnings to a much more manageable amount based on state, warning score, error class, significance and many other factors. Filtering can of course be done on the attributes that have been assessed, or on some of the other attributes associated with a warning:
- Significance refers to the high-level purpose of a class of warnings. In CodeSonar the significant classes are grouped as security, reliability, redundancy, style and diagnostic. Filtering warnings that focuses on reliability and security might be most important to review, in the short term, for a project adopting static analysis for the first time.
- Warning class is a specific indication of what a warning is checking for. For example, the LANG.MEM.NPD, Null Pointer Deference class warns of an attempt to deference a pointer at null address. Some warning classes might be more important to review that others. In above postgres example, Null Pointer Deference warnings make up 47% of all warnings.
- Warning score indicates both the severity of an error and the likelihood of the analysis being correct. A high score indicates a possible serious error with a high confidence in being a true positive result (correct) versus a false positive (warning that turns out to be incorrect.) A filter could choose to ignore low scoring warnings in order to focus on high impact, high confidence warnings.
- Specific files might be a cause for concern. Bugs and security vulnerabilities are likely to reside in large complex files and a significant number of reports in one file should be investigated. In the postgres example, the file pg_dump.c contained a large number of warnings.
ASSESSMENTS
It is important to realize that any assessment done on warnings is persistent from analysis run to analysis run. If something is marked as false or a real defect, there is no need to redo these assessments in the future and this work is not lost. This is a tremendous productivity booster compared to more compiler-like warnings that many people may be familiar with. There are multiple different attributes that are stored with a warning and that are part of the assessment that a software engineer can do:
- The State of a warning indicates its place in the assessment process. After the first analysis, all warnings are in state “None.” Over time, as warnings are reviewed they are placed in different states based on the outcome of the analysis and remediation. For example, a warningthat turns out to be a real error can be assigned to a developer to be fixed and marked as “assigned.” A warning that isn’t important right now can be marked as “Later.” Filters can be setup to look at only new warnings or to view only those that haven’t already been analyzed.
- The Priority of a warning is typically used by the engineer to indicate the urgency of a warning, or to suppress it in most searches.
EASING STATIC ANALYSIS ADOPTION
As with the postgres example, the number of warnings can be a deterrent to getting the most out of static analysis early in the project when it benefits the most. There are three key approaches to facilitate adoption:
- Filter and Focus: Filtering the viewed data from CodeSonar’s web interface, focussing on what is most important for the project and assigning developers to fix critical issues in priority order.
- Mark and Defer: Lower the priority, or change the state to “later”, for example, on all or a subset of the warnings based on some set of conditions that are less crucial to the project.
- Stop the Bleeding: Using the above techniques, to temporarely defer existing warnings with the emphasis on fixing new defects that are introduced as code is changed or new code is developed.
THE FILTER AND FOCUS APPROACH
The filter and focus approach attempts to address high priority warnings as part of the current workflow rather than at a later date. The team (or team leader) creates and saves searches on the dataset based on some property, for example, a directory, filename, or warning class. Developers are then directed to these searches to analyze them and assess the warnings and perform any fixes that are required. This is the quickest way to reduce the backlog of security and quality issues and establish a good understating of the quality and security status of the software.
EXAMPLES
Using the postgres example, the list of warnings with a score greater than 50 in the reliability and security classes, is much smaller and manageable (a list of 640 warnings versus 3757):
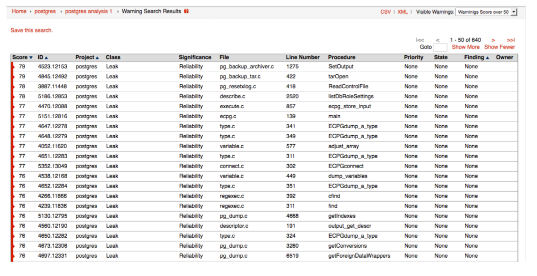
Figure 4: An example output from the postgres project filtered by a score of 50 or above
Consider another view, in this case, the list of buffer overrun and underrun warnings classes in the postgres example (a list of 157 warnings):
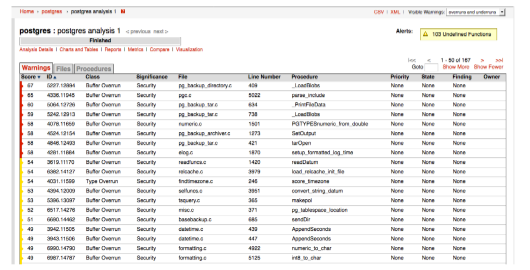
Figure 5: An example output from the postgres project filtered by buffer overrun and underrunerrors only.
Yet another example: Further investigation reveals that warnings with a score of over 50 in the reliability and security classes, are very prevalent in the file xlog.c (containing 58 warnings.)
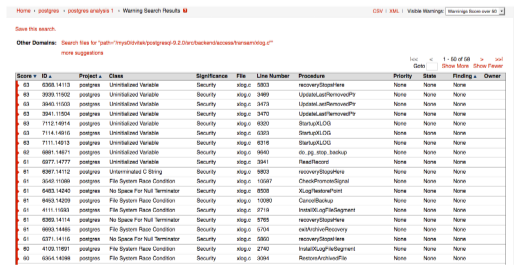
Figure 6: An example output from the postgres project for warnings with a score of 50 or above in the file xlog.c
It’s easy to see that an originally large list can be narrowed down to help focus software teams on the most important warnings with the highest confidence and the most problematic areas of the code.
A NOTE ON CONFIGURATION
Tool configuration is another option for specifying how a tool like CodeSonar behaves, including which warning classes are on by default. The default set by GrammaTech is a recommended baseline of important warnings that span the various class groups. However, this may not be ideal for every project and for a large code base, the default configuration can result in a large number of warnings.
CodeSonar’s default configuration shows off its superior depth in analysis. This can be customized by applying ‘presets’, collections of settings that GrammaTech has provided to further customize the depth. Of particular interest are the following presets:
- Intro; this is a preset used when first introducing static analysis to a project, it focusses on the most dangerous classes with the highest precision.
- Default; this preset provides good coverage for critical defects in each of the significant classes, a good second step when moving beyond the “Intro” preset.
- Thorough; this preset increases the compute time allowed for the analysis engine and hence finds deeper, more complex warnings. However, the analysis run does take longer due to the extra computation time allotted.
Of course, these presets can be customized further, for example to configure only the warning classes that are the most important for each software team. This is a good idea if certain warning classes are important to a project, for example, to make sure source code complies with MISRA C. There might be error classes that aren’t considered important and can be permanently removed from the analysis by configuration. However, the downside to this approach is that once disabled, the warning no longer appears in the analysis from that point forward. Warnings can be disabled individually for example, to disable the Unused Value warning, the configuration file needs the following:
WARNING_FILTER += discard class=”Unused Value”
Unused Value is part of a category called LANG.STRUCT. To disable all related warnings to this category, the configuration following can be added to the configuration:
WARNING_FILTER += discard categories:LANG.STRUCT
THE MARK AND DEFER APPROACH
Instead of creating searches, the team (or team leader) searches for defects that are low priority and uses the change-multiple-warnings feature to ‘suppress’ warnings. This hides them from the view of the software developers. The development team can then have a discussion later whether they want to go back and review these warnings.
EXAMPLES
Another approach which is a variation on filtering, indeed, filtering is still needed to avoid seeing all warnings in the CodeSonar hub. Unlike the filter view approach described above the “ignore everything” approach uses the warning state (e.g. “New”, “Assigned”, “Fixed”) Setting all of the warnings from the first static analysis run to “Later” removes all of the warnings from the normal active view (they can always be retrieved, when viewing all warnings.) Subsequent analyses (e.g. after every nightly build) that introduce new warnings will be clearly visible and in a much more manageable amount. Developers can commit to investigating and fixing just new bugs for now and go back to the list marked as later as time allows. Let’s consider another project, in this case, the UnrealIRCd open source chat server. The initial analysis finds 1182 warnings and by selecting all of these and setting the state to later, we remove them from the current active list.

Figure 7: A screenshot from CodeSonar showing how to multiple select warnings and set their state from with the web interface.
The current active list for the initial analysis is now empty. After running the analysis on a later build we only see the introduction of new warnings:
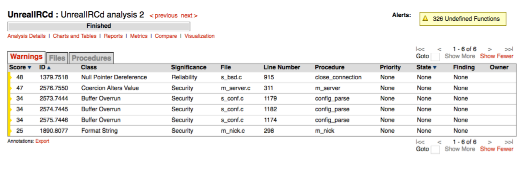
Figure 8: The output from the UnrealIRCd project after filtering all of the warnings from the first build.
After filtering the initial batch of warnings there is now a more reasonable set of warnings to investigate. However, there may be lingering bugs and security vulnerabilities in the initial group that need attention. In order to fully realize the benefits of static analysis some plan must be made to deal with these remaining bugs. The accumulation of bugs and security vulnerabilities over time is known as technical debt and eventually it can impede time and money needed for innovation.
STOP THE BLEEDING
In order to start improving the quality of a project, it’s important though to make sure that no new defects are being added as code is changed or new code is added. This is easily done in CodeSonar by creating a comparison between the latest build and the initial build to look for new warnings that were introduced due to new code, or changes to old code.
Many customers use a mix of all three options, Filter and Focus on the high priority warnings for example of category ‘Security’, or warnings in specific components that are business critical and then use “Mark and Defer” for less critical warnings (for example, ‘Dead code’ warnings) and ‘Stop the Bleeding’ to prevent new issues from being introduced.
EXAMPLES
Another approach to determine the list of newly introduced warnings between different builds in CodeSonar is to use the compare function. For example, the list below shows the difference between the first build of the UnrealIRCd project versus the second. This list just shows the newly introduced warnings in the latest version of the software. When trying to “stop the bleeding” it’s important to at least address critical warnings introduced at each new build. The compare function makes it easy to determine where to focus efforts after each build.
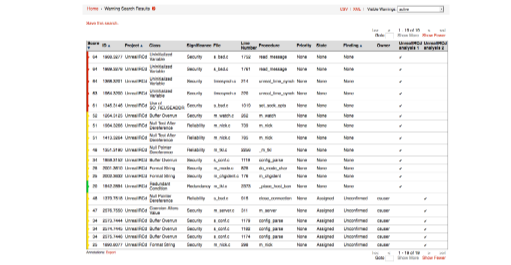
Figure 9: A comparison of second build of the UnrealIRCd project versus the first. This shows just the new warnings introduced in the second build.
INTERPRETING RESULTS, FALSE POSITIVES AND NEGATIVES
Static analysis tools are essentially detectors of defects, so some of the vocabulary from information retrieval is appropriate here.
- Recall is a measure of the ability of a tool to find real defects. It is defined as the ratio of defects that the tool finds over all defects. A tool with 100% recall can find all defects and is said to be sound.
- Precision is a measure of a tool’s ability to exclude false positives, defined as the ratio of true defects reported in the total number of warnings.
Precision is easy to measure once warning reports have been triaged but it is very difficult to measure recall accurately because the number of false negatives (defects that were not found) is unknown. Measuring it requires knowing exactly how many defects there really are in the code under analysis. It is important to point out that precision and recall can vary enormously among defect classes, even for a single tool. A tool that is very good at finding buffer overruns may not necessarily be very good at finding resource leaks.
FALSE POSITIVES AND NEGATIVES ARE INEVITABLE
For the majority of users, the real measure of the usefulness of a static analysis tool is whether it can find a reasonable number of important bugs in their programs without overwhelming them with useless reports, all without using an unreasonable amount of computing resources. The rub is that the very same properties that make these tools practical to use also mean that they are vulnerable to false positives and false negatives.
Static analysis tools work by creating a model of the code to be analyzed, and then querying that model in various ways. The model usually consists of a set of intermediate representations such as symbol tables, abstract syntax trees, control flow graphs, the program call graph, and so forth. The querying mechanisms can range from simple searches of those data structures through very sophisticated algorithms based on advanced concepts such as dataflow analysis, symbolic execution, abstract interpretation or model checking. Models are fallible and since the analysis depends on the fidelity of the model, the analysis is susceptible to misinterpretation and false or missed reports.
Unfortunately, the analysis algorithms are not perfect, they need to make their approximations such that they will scale to large programs. The market demands tools that complete in a small multiple of the time to do a regular build. Unfortunately, many of the algorithms are fundamentally super linear if they are to be precise. For example, consider an analysis that is path sensitive: capable of computing information about individual paths through the program. The number of paths through a single procedure with no calls or loops is exponential in the number of conditionals. One often quoted statement is that the number of paths through software of reasonable size, such as the Linux kernel, is larger than the estimated number of atoms in the known universe. Clearly no algorithm can hope to be approximately linear if it tries to enumerate all possible paths separately. Instead, tools reason about paths in the aggregate, and deploy other strategies like heuristics to keep the analysis close to linear.
HUMAN FACTORS IN INTERPRETING RESULTS
Static analysis tools are designed to produce reports that then get triaged by a human. Both the users and the tools themselves are flawed to some extent. Naively, it would appear that the most effective tool is the one that finds the most real bugs, i.e. the one with the highest recall. However, even a tool with perfect recall can be worse than useless if it also has poor precision. Too many false positives can drown out the true positives, which wastes time and makes it very difficult for a human to tell them apart.
Consider the example in Figure 10. Not using a tool all means all possible detected bugs are missed. On the other hand, a perfect tool finds all the bugs with no false positives. Tool A has good recall and precision which results in finding much of the real bugs with a fair amount of false positives. Tools B has high precision but poor recall, resulting in low false positives but a higher number of missed real errors. Tool C has poor precision but high recall, resulting in detecting all of the possible errors but a very high number of false positives. Realistically, a commercial static analysis tools has to balance precision and recall to achieve make sure critical bugs aren’t missed without burdening the development team with too many false positives.
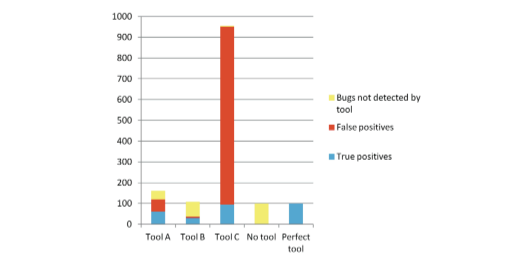
Figure 10: A comparison of the results from 4 different tools and using no tool at all.
There are ways to efficiently process and dismiss of false positives in bulk, assuming that they are easy to recognize, and many tools can be configured to do so automatically. It is also possible to reduce the human workload by automatically prioritizing warnings based on risk. However, it remains true that once this is done, the remaining warnings will still consist of some true and some false positives, and that it requires human judgment to tell them apart.
Users dislike false positives, often intensely. This strong emotional reaction has a disproportionate effect on the way tools are designed, configured and used. If given a choice between a configuration A that reports 40 real defects and 10 false positives, and a configuration B that reports 50 real bugs but with 50 false positives, users will almost always prefer the former, even though it is finding fewer real defects. This is perfectly understandable — users are being asked to weigh an immediate concrete negative (time spent looking at false positives) against an intangible potential future positive (bugs that may not show up).
However, if one offsets the time and risk saved in finding those 10 bugs earlier (i.e. by avoiding expensive and potentially dangerous bugs in finished products) against the time needed to assess the additional 40 warnings as false positives, then it quickly becomes apparent that the configuration B is the more economical. This is especially true in the domain of safety and security critical software, where a defect that slips through testing can have expensive consequences. For example, an estimate of 1 hour savings in finding a bug early against 5 minutes to assess a warning as a false positive, still saves 10 hours in bug finding at the cost of 200 minutes of assessing the false positives.
When interpreting the results, possibly numerous, produced by static analysis bear in mind the delicate balance between recall, finding all possible real errors, and precision, the amount of these reports that are real or not. Using a combination of filtering described above and concentrating on high risk warnings it’s possible to narrow down the workload. Despite the fact there are false positives remaining in this group, the tradeoff is detecting critical defects and security vulnerabilities that can (or may have already) elude other forms of testing.
WORKFLOW INTEGRATION
Static analysis can be used as soon as code is available in a project. In fact, as soon as it’s been typed in by a developer – the sooner the better. In the case of legacy, third party and existing code, static analysis can be run on those products before even starting the current project. In general, however, static analysis tools fit in a typical software development lifecycle as follows:

Figure 11:The relative places where dynamic and static analysis tools are using during the software development lifecycle.
Dynamic analysis tools can only be used when runnable pieces of code are ready. In terms of integration into an agile process, Continuous Integration (CI) and DevOps workflows, static analysis tools are a great addition to dynamic analysis. Consider two popular tools used in these modern processes, JIRA for feature and issue tracking and Jenkins for continuous build and integration. CodeSonar integrates into both products in order to support teams that use these and other tools as part of their existing agile process (or any type of process really).
STATIC ANALYSIS IN CONTINUOUS INTEGRATION, CONTINUOUS DEPLOYMENT PROCESSES
Continuous integration and deployment processes rely on automation in order to realize the benefits thereof. Without efficient progress through the cycle, the continuous nature of the processes amplifies inefficiencies. For example, introducing bugs that are inevitable whenever code is changed and new features are implemented, the detection, diagnosis and remediation of these bugs can slow the entire process down. Introducing static analysis in to the process ensures better quality code introduced into the continuous process and also detects new bugs introduced before unit testing (and often after!) is performed. Consider a typical continuous deployment cycle as in Figure 11, static analysis plays a key role in the review, develop and test phases of each cycle.
During the develop phase, static analysis provide quick feedback on found bugs, coding standard violations and poor coding practices. A commit into source configuration control is only accepted when the new code passes static and dynamic analysis crtieria. Deeper more details analysis is performed during the test phases which includes tainted data and concurrency checks. During the review phase, static analysis results warning of potential security vulnerabilities are analyzed and evaluated.
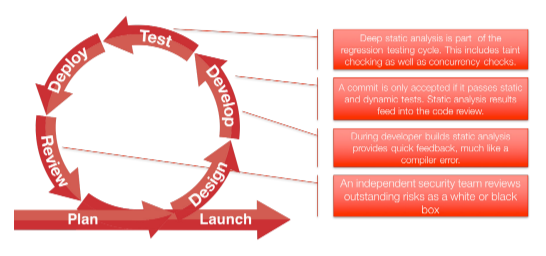
Figure 12:The role of static analysis in a typical continuous integration/deployment process
THE ADDED BENEFIT OF BINARY ANALYSIS
GrammaTech CodeConar has the unique ability to perform advanced static analysis on binary code. This provides added benefits to the continuous integration process, especially when incorporating third party binaries or legacy libraries. If source code is not readily available, this does not preclude the ability to detect bugs and security vulnerabilities. In addition, binary analysis can be used by security teams to perform “black box” analysis of product deliverables.
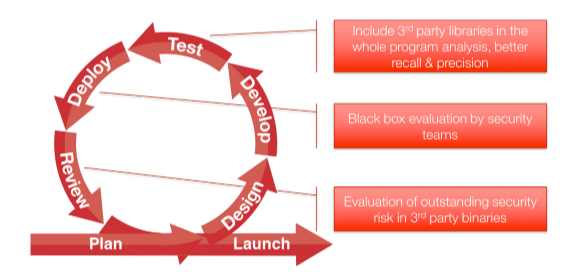
Figure 13:The role of static analysis in a typical continuous integration/deployment process
JIRA INTEGRATION
Altassian’s JIRA is one of the most popular issue tracking tools. GrammaTech provides an integration that allows for tracking of warnings as issues in JIRA so that they become part of the regular issue/feature workload for developers. An example of this integration is show below in the following screenshots:

Figure 14:The JIRA integration within CodeSonar allows for the creation of a JIRA issue.
The same warning as seen with JIRA:

Figure 15:The CodeSonar warning as an issue within JIRA.
JENKINS INTEGRATION
Jenkins is a popular build and deployment automation server that’s gained favor with teams doing continuous integration and delivery. CodeSonar analysis can be performance as a post-build action in Jenkins. Any automated build process can kick off a static analysis run which will populate new warnings related to the latest build. See below for an example of GrammaTech plugin for Jenkins:

Figure 16: The post-build action dialog from the CodeSonar plug in within Jenkins.
SUMMARY
The adoption of static analysis as part of a development process of an existing software project may seem daunting at first. However, there are simple techniques that can be applied to reduce the initial volume of warnings to make the tools and the process more palatable to new users. Using the tried and true approach of concentrating on critical issues first, deferring less critical issues provides and preventing regression delivers the best return on investment for static analysis. GrammaTech CodeSonar provides all the capabilities needed to introduce static analysis into your project and integrates with leading development and agile/DevOps tools in use today. Integrating static analysis into an existing process shouldn’t be a large hurdle for software development teams.