INTRODUCTION
Advanced static-analysis tools are popular because they have proven effective at finding serious programming defects. In contrast to traditional dynamic testing, the code is never executed so there is no need for test cases. This means that static analysis can be applied very early in the development process. When programmers use static analysis as soon as code is written, bugs and security vulnerabilities can be found and eliminated even before the unit testing or integration testing phases. The earlier a defect is found, the cheaper it is to fix; this cost saving is a major advantage of automated static analysis.
The latest static-analysis tools represent a significant technological improvement on early-generation tools. These new tools use sophisticated whole-program techniques to find defects and are typically used on large quantities of source code written in high-level languages such as C/C++ and Java, or even on object code. Such tools are the subject of this article.
Of course these tools are not perfect; for most non-trivial programs no practical tool can find all bugs (i.e., there are false negatives), and all such tools may also report problems in code that is defect free (i.e., false positives). As I will explain later, given the technology and resources generally available today, this is inevitable. Because of this, all warnings from a tool must be inspected by a human to determine whether or not they indicate a real problem, and whether they warrant action. This process is known as triage.
There is a strong inverse relationship between false positives and false negatives. Tools that find more real defects (true positives) generally also have a higher rate of false positives. Even for a single tool, there are typically configuration options that allow end users to control the underlying analysis to favor one end of the spectrum over the other.
Users dislike false positive results for various reasons, so prefer tools (or configurations of tools) that keep the false positive rate low. However, this comes with the risk that the tool might fail to report real defects. The most effective tool is one that strikes the right balance between false positives, false negatives, and performance. When deploying one of these tools, or deciding which tool to purchase, users should consider this tradeoff to maximize the benefit of using the tool. There are lots of factors that influence this decision. In this paper I will describe the important considerations and parameters, then describe a model that can help users measure the benefit of a static-analysis tool and assess how best to configure it. Equations derived from the model allow users to compare tools using simple warning report counts.
TERMINOLOGY
First I would like to briefly introduce some terminology. Static analysis tools are essentially detectors of defects, so some of the vocabulary from information retrieval is appropriate here.
Recall is a measure of the ability of a tool to find real defects. It is defined as the probability that a tool will find a defect. A tool with 100% recall can find all defects and is said to be sound.
Precision is a measure of a tool’s ability to exclude false positives, defined as the probability that a result corresponds to a real defect.
Precision is easy to measure once warning reports have been triaged but it is very difficult to measure recall accurately because the number of false negatives is unknown. Measuring it requires knowing exactly how many defects there really are in the code under analysis.
It is important to point out that precision and recall can vary enormously among defect classes, even for a single tool. A tool that is very good at finding buffer overruns may not necessarily be very good at finding resource leaks.
WHY FALSE POSITIVES AND NEGATIVES ARE INEVITABLE
Let me first be a little pedantic and point out that it is in fact possible — even easy — to write a tool that has zero false negatives, i.e. it finds all bugs and security vulnerabilities in all programs. The program that unconditionally prints “There is a defect on every line of your program” will do. Similarly, it is equally easy to create a tool that reports no false positives; one that always prints “Your program has no defects” suffices. There is a third extreme: it is theoretically possible to write a tool that has almost no false negatives and close to zero false positives that works for many plausible programs. This tool would find errors by systematically exploring all concrete states of the program with all possible inputs, and looking for error states. In theory this is possible because digital computers are ultimately finite state, but the number of states is so vast that such a tool would take eons to complete even for very modest programs. Obviously none of these tools is useful other than to illustrate the extremes and that there is an innate tension between precision, recall and performance.
For the majority of users, the real measure of the usefulness of a static analysis tool is whether it can find a reasonable number of important bugs in their programs without overwhelming them with useless reports, all without using an unreasonable amount of computing resources. The rub is that the very same properties that make these tools practical to use also mean that they are vulnerable to false positives and false negatives.
Static analysis tools work by creating a model of the code to be analyzed, and then querying that model in various ways. The model usually consists of a set of intermediate representations such as symbol tables, abstract syntax trees, control-flow graphs, the program call graph, and so forth. The querying mechanisms can range from simple searches of those data structures through very sophisticated algorithms based on advanced concepts such as dataflow analysis, symbolic execution, abstract interpretation or model checking. The important thing to emphasize is that the analysis operates not directly on the program, but on a model of the program, and models are almost never exact — they are either over- or under-approximations. If a model is exact or an over-approximation, then it is said to be sound because it captures all possible behaviors of the actual program. A sound model with a sound analysis will yield results with no false negatives. If a model is an under-approximation then it fails to capture some relevant aspect of the program and false positive results can be generated, regardless of whether the analysis is sound or not.
To understand why it is practically impossible to create an exact perfect-fidelity model of a program, it is worth describing how a tool might do so. If the tool is operating on source code it will first have to parse the code in exactly the same way as it is parsed by the compiler used to create the object code. Then the analyzer must have precisely the same interpretation of the language semantics as the compiler so that it can create a model that accurately reflects what will happen when the program executes. Language specifications are riddled with problems that make this difficult. For example, the new C++11 standard enumerates dozens of unspecified, undefined and implementation-defined behaviors, and the list for C1X runs to 24 pages. In the face of these, compilers can and do make different choices, and which choices are made are mostly invisible to the analysis tool. Also, the same code can have subtly different behavior depending on the platform for which it is compiled. Elsewhere, I give more details of handling issues like this [3] as do Bessey et al [4].
Then there is the issue of what happens when the program under analysis contains code that is unavailable. Say the program makes a call to a third-party library for which only object code is provided. An exact model must reflect the semantics of what happens when that call executes, but the source code is not there to be analyzed, so it is impossible to create an exact model.
For tools that analyze object code, some of these barriers to an exact model are removed; there is no ambiguity about how to decode an instruction, and it is possible to analyze non-source components. However object-code analysis has its own set of complications. Distinguishing code from data is fundamentally undecidable, and object code can contain traps to the operating system, which are effectively equivalent to calls to code that cannot be seen by the analysis.
Although it is practically impossible to create a perfect model for all programs, it is possible to disallow some of the problematic program constructs, effectively creating a subset of the original language. Some program verification systems take this approach, and there have been some remarkable successes for some specialized domains such as the core parts of highly safety- or security-critical code.
Because of these difficulties all general-purpose practical static analysis tools create program models that are over-approximations in some senses and under-approximations in others, so even if the analysis algorithms were perfect, false positives and false negatives would inevitably slip in.
Of course the analysis algorithms are not perfect either. They make their own approximations. The most compelling motivation for this is so that they will scale to large programs. The market demands tools that complete in a small multiple of the time to do a regular build. Unfortunately, many of the algorithms are fundamentally super linear if they are to be precise. For example, consider an analysis that is path-sensitive: capable of computing information about individual paths through the program. The number of paths through a single procedure with no calls or loops is exponential in the number of conditionals, and once calls are introduced the number is doubly exponential. Clearly no algorithm can hope to be approximately linear if it tries to enumerate all possible paths separately. Instead, tools reason about paths in the aggregate, and deploy other strategies to keep the analysis close to linear. Some tools place an upper limit on time spent in various phases; some sever cycles in the call graph and hence ignore recursion; others cap the amount of information stored.
WHEN TRUE IS FALSE
So far I have been using the traditional technical definitions for true and false positive — a true positive is a correct report about a real defect, and a false positive is a report about a bug that does not really exist. However, this is almost never the exact criterion that end users employ when looking at reports. What really matters to an end user is whether the report yields useful and actionable information. There is a great deal of variation in how to interpret results depending on the nature of the defect, the role of the user, the platform on which the application will run, and the environment in which it is deployed. In “Mistakes That Matter” Bill Pugh describes his experience with this issue when deploying static analysis at Google [7].
Take for example a true-positive report of a buffer overrun, one of the most notorious classes of C/C++ defects from a security perspective. In the early stages of application development it almost always makes sense to change the code to fix such a bug. The programmers are actively changing the code anyway so fixing it involves little extra overhead. However if the same defect is found after the application has been deployed then it is much trickier to decide whether it is worth fixing. It might be a benign buffer overrun that overwrites a single byte of otherwise unused memory, so impossible for a malicious attacker to exploit. In such a case it might be very expensive to fix the code, retest the application, and redeploy it. This expense, coupled with the risk that any change to the code may introduce a new defect, may mean that it is just not worthwhile to correct the defect at that time.
There are plenty of other examples where the perspective of the user determines whether a report warrants action. For example, a security analyst will typically consider a redundant condition warning (i.e., a condition whose value is always true or always false) unhelpful, but the person charged with testing that code to achieve 100% condition coverage would be happy to get such a report because it means that they don’t have to waste time trying to generate data to test the impossible.
Counter intuitively, there are even situations where it makes sense to change the code in response to a false positive report. Many programmers react strongly to this; after all, the tool is clearly wrong about the program, so why would they need to change the code? The answer is non-obvious at first: the tool is wrong because it is confused about something and so that same confusion may be preventing it from finding a real underlying defect. By changing the code, the programmer is making it easier for the analysis to produce useful results, thereby increasing the chance of it finding real defects. Changing the code leverages the power of automation. Such changes also make the code easier for a human to understand. This principle is a core tenet of Holzmann’s “Power of 10” rules for safety-critical programming [5].
The key point is that software development is an economic activity — the challenge is to make the most effective use of the resources available. The cost to fix a real bug may exceed the benefit of fixing it, and the benefit of “correcting” a false positive may exceed the cost of leaving it alone. Tools don’t have good ways of judging such things, and can only be relied on to give narrow technical answers. It is proper that humans be the judge of which static analysis results should be acted upon. Of course humans are not perfect judges either, and there are some pitfalls associated with interpreting static analysis results as I’ll explain in the next section.
HUMAN FACTORS
Static analysis tools are designed to produce reports that are subsequently then get triaged by a human. However, we humans make mistakes. We have innate cognitive biases, a limited attention span, and get distracted easily. We may misjudge some reports and we may introduce new errors as we fix old ones. In order to understand how to make best use of a static-analysis tool, it is essential to take these frailties into account. Naively, it would appear that the most effective tool is the one that finds the most real bugs, i.e. the one with the highest recall. However, even a tool with perfect recall can be worse than useless if it also has poor precision. Too many false positives can drown out the true positives, which wastes time and makes it very difficult for a human to tell them apart. It takes some care to distinguish a true positive from a false positive, and if a user is accustomed to looking at false positives all day, a fatigue sets in that makes it more difficult to find the real bugs.
There are ways to efficiently process and dismiss of false positives in bulk, assuming that they are easy to recognize, and many tools can be configured to do so automatically. It is also possible to reduce the human workload by automatically prioritizing warnings based on risk. However, it remains true that once this is done, the remaining warnings will still consist of some true and some false positives, and that it requires human judgment to tell them apart.
Users dislike false positives, often intensely. This strong emotional reaction has a disproportionate effect on the way tools are designed, configured and used. If given a choice between a configuration that reports 40 real defects and 10 false positives, and a configuration that reports 50 real bugs but with 50 false positives, our experience is that users will almost always prefer the former, even though it is finding fewer real defects. This is perfectly understandable—users are being asked to weigh an immediate concrete negative (time wasted looking at false positives) against an intangible potential future positive (bugs that may not show up). Also, this is not to say that the users are necessarily wrong to do so. Perhaps the expense spent poring over those extra 40 false positives exceeds the benefit of finding and fixing those 10 extra defects.
THE MODEL
Many factors contribute to the economics of static-analysis tool use, and the relationships between them are not always straightforward. The model I introduce here is a coarse approximation that attempts to capture the important aspects of the process. It attempts to be useful while remaining simple, so some subtleties are not considered. Let f(P) be the function that maps the precision of a tool to the probability that a true positive is recognized correctly. The effectiveness of a tool, i.e., the number of real defects found and recognized as such is thus given by:
N ×R ×f(P)
Given these definitions, we can see how good some example tools are at finding real defects.
Let us now consider three hypothetical tools (or configurations of the same tool) that occupy a position along the recall-precision spectrum discussed earlier.
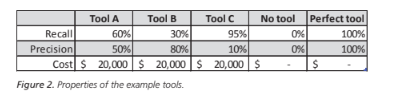
Tool A is reasonably good at finding defects, with a recall of 60%. Half of the results it reports are false positives.
Tool B has a precision of 80%, meaning it is very good at suppressing false positives. However, it finds only 30% of the real defects.
Tool C has a recall of 95%, so is extremely good at finding defects, but its precision is only 10%.
It is also useful to consider two other cases: the mythological perfect tool that finds all defects with no false positives, and not using a static analysis tool at all. The tool properties are summarized in Figure 2.
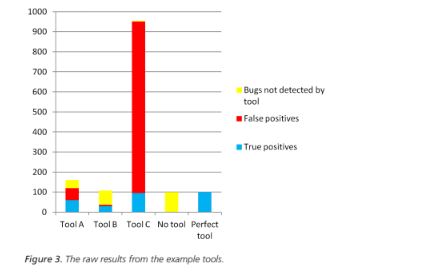
Let us suppose that the number of defects that are not detected by other means is N=100. Figure 3 shows the raw results from the tools.
Now what really matters is how those raw results are interpreted. As discussed above, some real defects will not be recognized as such. Figure 4 shows two histograms of the defects that remain in the application under the linear and cubic models for true positive recognition.
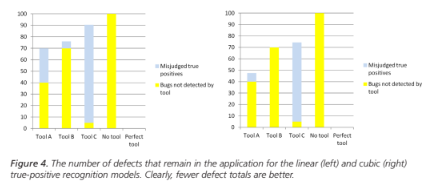
What emerges from this model is that there is a sweet spot in the tradeoff between precision and recall. Tool A had worse precision than tool B and worse recall than tool C, but when it is used, fewer defects remain in the application.
ECONOMICS
Now we can model the economic aspects of the process. The important inputs are as follows:
The probability and cost of an incident caused by a defect. Software defects and security vulnerabilities are depressingly commonplace, but not all of them cause serious problems. Many lie dormant and unexploited before they are removed through routine maintenance. This can be modeled by assigning a probability that a defect will trigger an incident during the lifetime of the product. If a defect does cause an incident there will be a cost of dealing with that incident, and this cost can vary enormously. Incident consequences can include product recall, disruption to service, damage to reputation, theft of property, litigation, and even death or injury if the application is safety-critical. The best case is that few customers are harmed or inconvenienced by the defect and that the defect is fixed and deployed through normal maintenance processes, but even that has a cost. The numbers shown on the next page in Figure 5 are based on a probability of 5% and an example incident cost of $40,000.
The time to correct a defect. Regardless of whether a defect causes an incident, there is an engineering cost to fix it. Bugs that are found earlier are much less expensive to fix. Those that are found late can be especially costly as the product may have to be re-tested. In the calculations below we assume it takes 4 hours to fix a bug early in the development cycle, versus 20 to fix it after deployment. These numbers are based on a 2002 NIST report [1].

The time to triage warnings. It takes time to triage a warning report from a static analysis tool. Most can be triaged quite quickly, but complicated reports may involve lengthy paths through the code, multiple levels of indirection, and complex relationships between variables. Such reports can take a non-trivial amount of time to triage. We have found that triage takes about ten minutes per warning on average, and this has been confirmed by others [6].
Engineering labor. This is modeled at $75/hour including overhead.
Tool deployment cost. This includes the cost to purchase the tool and to deploy it on the code. The model assumes that Tools A, B and C cost $20,000 and that the two controls have zero cost.
With these variables as inputs, we can model the cost of using a tool as the sum of:
- The cost to purchase the tool and deploy it.
- The cost of the engineering labor for report triage.
- The cost to fix defects found by the tool.
We also need to add the cost of dealing with defects that are not found by the tool, which includes:
- The engineering cost to fix those defects.
- The cost of handling all the incidents triggered.
To judge the benefit of the tool we can compare these costs against the cost of dealing with the defects found if no tool had been used. Assuming the cubic model for true positive recognition, Figure 5 shows the cost breakdown and benefit.
Again the tool that strikes a reasonable balance between precision and recall is the one that is most beneficial to use. Tool A is more beneficial even though it found only about half as many real defects as Tool C, and had eight times more false positives than Tool B. It is also interesting to note that Tool C sits slightly below the break-even point, even though it has the highest recall.
The relative order of the tools is fairly insensitive to the actual numbers used for the cost and the probability of an incident as long as the cost of an incident exceeds the cost fixing the defects found by the tool. In such an extreme case however, the most cost-effective strategy is to use no tool at all.
This model confirms that the benefit of using a static analysis tool is dominated by its ability to find real defects that are subsequently recognized as such. Although there is a cost to triaging the warnings, this is relatively minor compared to the cost of an incident. Consequently we can conclude that a tool’s effectiveness, i.e. its ability to find real defects that are correctly recognized as such, is a good approximation to its overall benefit. Note however that this requires knowing the value of recall, which as discussed earlier is notoriously elusive. The next section describes how we can eliminate that unknown and use the model to compare tools using easily-harvested data.
CONCLUSIONS
Static analysis tools are effective at finding serious programming errors and security vulnerabilities. However they are not verification tools, so they may miss some problems and may report false positives. Precision and recall seem to be closely coupled, so that increased precision yields decreased recall and vice versa. Most tools allow users to configure the analysis to favor one end of this spectrum over the other. It is important that the rate of false positives be low because too many can render a tool unusable, regardless of how sophisticated the underlying analysis is. However this must be balanced against the risk of the analysis failing to find real bugs.
Users generally feel better about configurations that keep false positives very low, but the model shown here demonstrates that the sweet spot that maximizes the benefit of using the tool means it is worth tolerating a much higher false positive rate as long as the tool is also finding more real issues. Users can employ this model to help make rational decisions about how to deploy static analysis in their organization. The model is easy to use, requiring only simple counts of true and false positives: data that is easily obtained.
This conclusion can also help tool makers make decisions about how to design their tools. A key aspect of the triage process is the risk that real defects may be unrecognized. A user interface that explains clearly the evidence and reasoning behind a defect report, and that helps the user understand the most important relevant aspects of the code can help minimize that risk.
Although the observations discussed above are based on experience running static analysis tools on hundreds of millions of lines of code, there is no such thing as an “average” program. Different tools may use different approaches, and users have different concerns depending on their domain and their role. The best approach to using a static analysis tool is to try several on your own code to find issues that are important to you, and to compare the results rationally. The model presented is a tool to help decide which will benefit you the most.
REFERENCES
- The Economic Impacts of Inadequate Infrastructure for Software Testing, 2002, Research Triangle Institute, National Institute of Science and Technology, Washington, DC RTI Project No. 7007.011.
- Adams,E.N., Optimizing Preventive Service of Software Products. IBM Journal of Research and Development, 1984. 28(1): pp. 2-14.
- Anderson, P., 90% Perspiration: Engineering Static Analysis Techniques for Industrial Applications. In Proceedings of the 8th IEEE Working Conference on Source Code Analysis and Manipulation. pp. 3-12.
- Bessey,A., Block,K., Chelf,B., Chou,A., Fulton,B., Hallem,S., Henri-Gros,C., Kamsky,A., McPeak,S., and Engler,D., A few billion lines of code later: using static analysis to find bugs in the real world. Communications of the ACM, 2010. 53(2).
- Holzmann,G.J., The Power of 10: Rules for Developing Safety-Critical Code. IEEE Computer, 2006. 39(6): pp. 95-97.
- Jetley, R. P., Anderson, P., and Jones, P. L., Static Analysis of Medical Device Software using CodeSonar. In Static Analysis Workshop (SAW). 2008. Tucson, AZ: ACM Press.
- Pugh,W., Defective Java Code: Mistakes That Matter, http://www.cs.umd.edu/~pugh/MistakesThat-Matter.pdf.