
INTRODUCTION
Static analysis tools have been around for decades and have helped many customers improve the quality of their code by finding programming problems. There have been tremendous developments in the capabilities of static analysis tools, becoming more sophisticated compared to older commercial and open source offerings. The latest generation of advanced static analysis tools scan the entire body of code for a program and then use whole program analysis and abstract simulation to analyze the code, find problems, filter them and present them to users in a manageable and easy to understand fashion.
Advanced static analysis tools:
- are focused on finding serious bugs, not just violations of superficial programming rules
- perform deep path analysis calculating paths through the entire program
- can scan binary object files and libraries to improve the analysis
- help in the understanding of problems and go beyond file and line number in their reporting
- maintain annotations against the body of source code that persist in light of changes
- provide reports comparing runs, thereby helping program teams improve over time
The early-generation static-analysis tools were focused on single-user desktop use; programmers would run the tool on the code, as they would write it or just before check-in, to find simple mistakes. Such tools were good at finding things like parameter mismatches, or for doing stronger type-checking than that required by the compiler, but they were not good at finding bugs that depended on data flow across procedure or compilation boundaries, or other relatively simple whole-program properties.
Whereas advanced static analysis tools do support this model of usage, and can find such superficial properties, their role has expanded enormously over the past decade. The primary purpose of advanced static analysis tools is to find serious bugs very early in the development cycle, especially those that arise because the program is straying into undefined behavior, or because an API is being used in an illegal way. These are the kinds of bugs that are both most serious and most difficult to find. These tools are especially good at finding bugs that depend on corner cases in the code, or on paths that are infrequently executed, so commonly find bugs that are missed during conventional testing.
The impact is dramatic. Finding bugs early, during programming, saves significant time and money compared to finding bugs during testing, or even worse, in fielded product.
The other dimension in which advanced static analysis tools are different from the early generation of tools is that they are designed not just to help a single developer but to help teams of people collaborate on improving the overall quality of the software. It is common to use the advanced static analysis tools to do analysis as part of a continuous integration system, and for the results to be disseminated to all stakeholders—developers, testers and managers. Each can inspect the results and respond in a manner appropriate to their role, and those actions are shareable and visible to all.
Consequently, many modern software development projects use static analysis tools to a) do a quick sanity check of code during the check-in process and b) perform a deep analysis as part of the daily build and test cycle. Advanced static analysis tools support both these two usage patterns.
The quick sanity check is easy to perform and takes marginally more time than the compilation step. Whole program analysis is a different story. It is computationally expensive and in general, the more processing power you make available, the more useful the results will be. This is especially true for larger bodies of code (multiple millions of lines of code), or for programs with complicated dependencies between compilation units, or those that have lots of global variables.
EXAMPLES
In this paper we present a number of examples that provide more details to the types of problems that advanced static analysis tools can find. The goal is to highlight the benefit that deep program analysis can provide.
SIMPLE EXAMPLES
Static analysis tools are most useful for finding the serious bugs that can cause applications to crash or that introduce security vulnerabilities. Some of these include Buffer Overruns, Uninitialized Variables, and Use after Free errors, but are certainly not limited to that. Other areas include analyzing multithreaded race conditions, SQL injection, unreachable data flows and many others.
Buffer Overruns are extremely serious bugs. They can crash the program, but may also open serious security vulnerabilities.
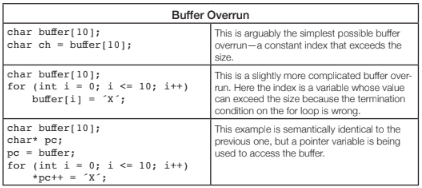
The first two problems are easy to find. The last example is typically only found by advanced analysis. There are more complex examples that are possible of course, where the flow of execution that leads to the buffer overrun crosses functions, or even compilation units (files). See the section on inter-procedural analysis later in this paper for more examples for these types program flows.
Uninitialized variables can be difficult to find during testing because their symptoms can be non-deterministic. The value in the variable may be valid in some cases and invalid in others, so they do not necessarily cause program failures.
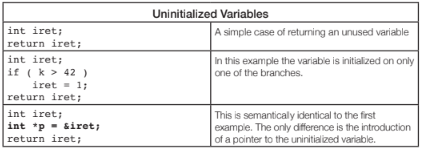
Again, the first two examples are easy to find, the last example is more difficult to find and requires more advanced static analysis to understand the aliasing between variables.
There are again other cases that make it even more difficult to find this where iret is passed as a pointer into a function that initializes the variable. The function may have many paths that initialize it, but may have an error path that does not.
Memory Leaks can cause running programs to get progressively slower and consume more resources until they finally fail.
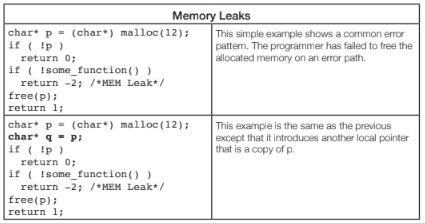
The second case is another example of the aliasing of variables, which is very common in the logic of even simple programs. The examples show problems with leaking memory, but other dynamically allocated resources such as file descriptors, graphics handles, network connections and such can also be leaked. Advanced static analysis tools can often even be extended to include domain-specific resources by implementing company, or domain-specific validation logic.
Use After Free bugs are another class of nasty memory errors that occur because the programmer has accessed a block of memory after it has been freed. If the memory allocator has re-used that block, then it may contain unrelated data. Again, the symptoms can be mysterious so these can be hard to diagnose and fix. Symptoms could be anything from a crash, to leakage of data, which can often lead to a security vulnerability.
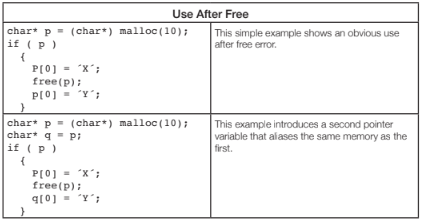
Advanced tools are able to detect the flow of the program and which variables are related and flag a warning on the second case.
CROSS PROCEDURAL EXAMPLES
All of the examples above can span multiple functions and compilation units. A function, of course, can have multiple paths through it, one path that can exhibit a problem, and one path that does not.
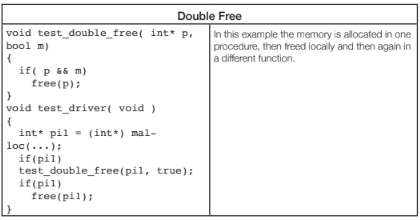
Advanced tools compute the multiple paths through test_double_free and detect that there is a problem here in the case where the second parameter is ‘true,’ while the problem would not exist if the function would be called with ‘false’ as the second parameter.
Buffer overruns can occur on both statically and dynamically allocated buffers.
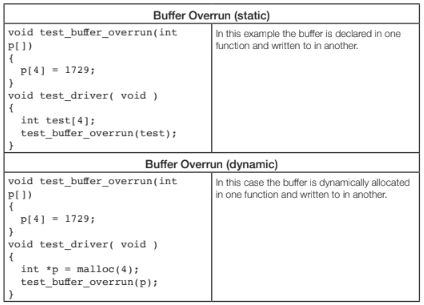
The fact that the buffer is defined in one function and overrun in another often poses problems for tools. Advanced static analysis tools easily detect these types of problems.
Null Pointer Dereferences are dangerous, they typically lead to a crash. Beyond the obvious problem to software quality, this can lead to a denial of service attack if this can be triggered externally.
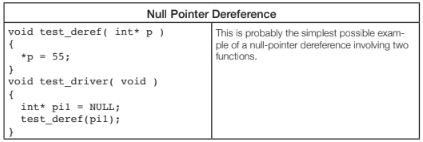
Advanced static analysis tools find this type of problem, especially if the functions are located in different computation units, which is often the case in real world software.

An advanced static analysis tool will be able to find this problem. Even better, imagine test_free is called from multiple different locations, sometimes with a value for x that is less than 10, sometimes with a value for x that is >=10. Advanced static analysis tools are able to alert the user that some usages of the function are valid and that some have a memory leak.
INCLUDING LIBRARIES
All the examples above talk about a body of source code, but sometimes programs depend on 3rd party libraries that are only available in object form. For advanced static analysis tools this is not a problem. They can lift the object code, add it to the whole program model and do static analysis on the entirety of it. The tools, for example, find problems where a NULL pointer is passed into a library function when this was not expected.
EXAMPLE SUMMARY
All of the above examples are very simple. Real code is much more complicated; there are many compilation units, lots of levels of abstraction, and very intricate aliasing relationships between variables. The snippets above provide examples to help you understand some of the complexity involved in static analysis. It is important to understand how variables are used in your programs and how they flow across component boundaries.
Advanced static analysis tools can find more problems due to the following techniques:
- A precise whole-program model. They parse your code in the same way your compiler parses it, so the program model reflects the code that will actually be executed. It then analyses the entire program, not just a single file at a time. Thus it can track how data can flow between variables that are shared among multiple compilation units.
- Interprocedural analysis refers to a tool’s ability to track how data is passed from one procedure to another through parameters or shared global variables.
- Context sensitivity means that a tool understands that a function can be called from different locations (contexts) with different parameter values, meaning that it treats each procedure call site separately.
- Alias analysis determines when different memory accesses in the program overlap, which is essential for reasoning about pointer variables, especially in the presence of pointer arithmetic. This is of course especially important in C programs because pointers are used very widely.
- Path-sensitive analysis means that the tool explores individual paths through the program, so it can show not just the point in the code where the bug causes damage, but also all the important locations in the code that led up to that point.
- Constraint analysis is used by static analysis at several levels. First, a relatively lightweight engine is used to generate candidate warning paths. Next, a more heavyweight analysis engine is used to prune the set to only those that are judged to be feasible to execute.
- More checkers that are able to validate more rules, including rules around taint (dangerous information) that impact security and concurrency.
These techniques are all due to evolutions in the field of static analysis. A lot of research has been going on in this field and much research is still being done. Advanced static analysis tools perform their analysis runs on a comprehensive model of the entire program. Computing through these models is computationally heavy, especially as larger programs can have millions of lines of code. Advanced tools know how to do the deep analysis required in a parallel fashion such that end-to-end run times remain realistic for daily builds or even developer builds.
USER INTERFACE
The quick sanity check at check-in time is typically run from the command line and reports findings in a compiler-like fashion. That is, report filename, line number, position and a simple, one-line description of the problem encountered, all in plain text.
It is clear that this reporting style is no longer sufficient when one is considering path-sensitive problems reported by more advanced tools. While the problem will still have a filename, line number, and position, there is a lot more information needed for the developer to understand the full path that lead the tool to believe that a problem exists. As an example, here is the output for a sample problem that provides comprehensive program flow and context information:
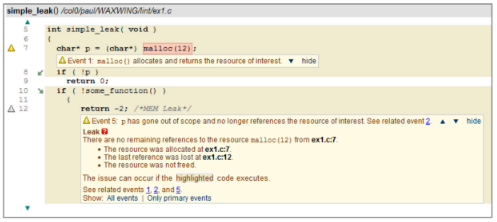
It is worth highlighting some of the details in this report.
- The path that must be followed in order for the leak to happen is highlighted. Note the small green arrows on lines 8 and 10. These show that the path follows the false branch and the true branch of the respective conditionals.
- Important points along the path are singled out. In this case the first interesting point is where the memory is allocated.
- A detailed explanation of the warning is given at the point where the memory is leaked on line 12, with links to those other points.
(this example is taken from CodeSecure’s CodeSonar, which performed advanced static analysis on whole program models)
Advanced static analysis tools are designed to help the user understand why the warning was reported, but also to help the user judge how serious the problem is. Consequently, there are many features that allow the user to navigate around the program to see how the various components are related.
A critically important point here is that this user interface is tightly coupled with the analysis engine. If a user wants to see more details, he can drill down deeper. For example, a buffer overrun may be exploitable along some call chains, but not along others, and the analysis can be tasked with distinguishing these.
SUPPORT FOR TEAMWORK
Software development is team-work. Development teams need to be able to look at warnings, assess them, make annotations, assign them and such. These annotations need to be maintained in the light of changing source code.
This is an important feature for scalable analysis tool usage. Typically warnings are maintained in a database that can be assessed through a convenient web-based GUI that all developers have access to. Everybody can access the results, annotate and create reports.
For example, if Alice notices a warning report in code she has knowledge of, she can take ownership of it and assign a priority. If Bob notices the same warning, he will see immediately that it is being taken care of. Or if Charlie notices a warning and concludes that it is a false positive (all tools report some), he can mark it as such so nobody will ever have to look at it again.
HISTORY
Maintaining a history that includes the record of every analysis done on the project code is an essential feature to support team development. Because the results go into a persistent database, it is possible to see how things change over time.
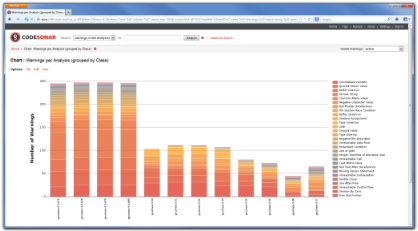
This example shows the warnings found in multiple analyses of many versions of the same product. From this it is easy to monitor progress.
CONCLUSIONS
The field of static analysis has changed. While early static analysis tools or open source tools provide value in the software development lifecycle, advanced tools deliver many times more value due to the fact that they find more true bugs earlier in the development cycle. They do this because they perform deeper and more comprehensive analysis on the entire program while providing a scalable user interface and reporting engine.
The result is a more efficient software development lifecycle, where more bugs are found early on in the development phase. The best way to appreciate the benefits of advanced static analysis tools is to try it on your own code. CodeSecure offers a free time-limited evaluation of their advanced static analysis tool CodeSonar on http://go.codesecure.com/
